Marion Lake

Location Details

Description

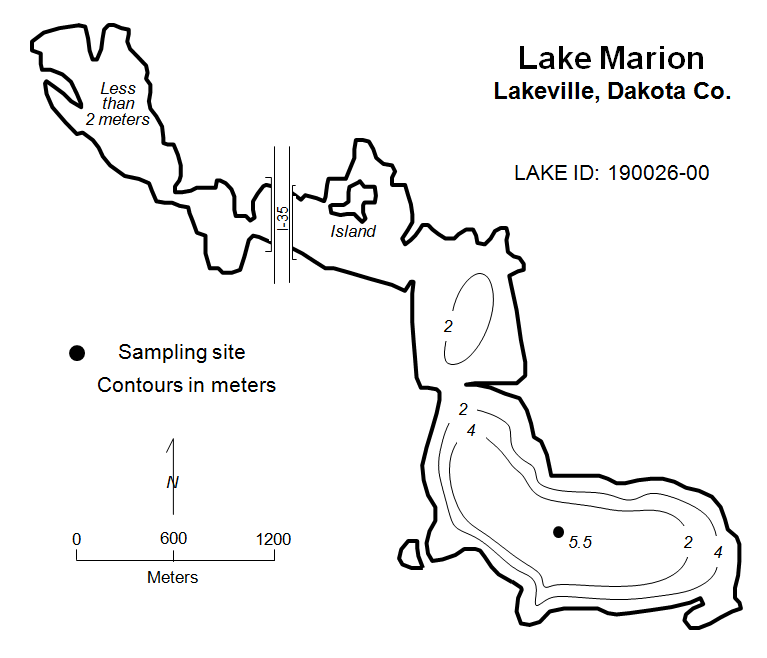
Marion Lake is located in Lakeville. It covers approximately 560 acres and has three main sections. The East, Middle, and West Bays cover about 302, 187, and 126 acres respectively. The maximum depth of the lake is about 6 meters and is located in the East Bay.

Waterbody Name
Marion Lake, Site 1
Location Type
Lake
City
Lakeville
County
Dakota
Water Management Organization
Vermillion River Watershed JPO
Major Watershed
Mississippi River - Lake Pepin
HUC8
07040001
Latitude
44.658257
Longitude
-93.275570
DNR Lake ID
19002601

Data Collected

Expand the menus below or use the search bar to select individual parameters and display availability of data on the right

Available Parameters

Data Availability over Time

      • The data for this chart is based on monthly increments
      • The data for this chart is based on monthly increments
      • The data for this chart is based on monthly increments
      • The data for this chart is based on monthly increments
      • The data for this chart is based on monthly increments
      • The data for this chart is based on monthly increments
      • The data for this chart is based on monthly increments
      • The data for this chart is based on monthly increments
      • The data for this chart is based on monthly increments
      • The data for this chart is based on monthly increments
      • The data for this chart is based on monthly increments
      • The data for this chart is based on monthly increments
      • The data for this chart is based on monthly increments
      • The data for this chart is based on monthly increments
      • The data for this chart is based on monthly increments
      • The data for this chart is based on monthly increments
      • The data for this chart is based on monthly increments
      • The data for this chart is based on monthly increments
      • The data for this chart is based on monthly increments
      • The data for this chart is based on monthly increments
      • The data for this chart is based on monthly increments
      • The data for this chart is based on monthly increments
      • The data for this chart is based on monthly increments
      • The data for this chart is based on monthly increments
      • The data for this chart is based on monthly increments
      • The data for this chart is based on monthly increments
      • The data for this chart is based on monthly increments
      • The data for this chart is based on monthly increments
      • The data for this chart is based on monthly increments
      • The data for this chart is based on monthly increments
      • The data for this chart is based on monthly increments
      • The data for this chart is based on monthly increments
      • The data for this chart is based on monthly increments
      • The data for this chart is based on monthly increments
      • The data for this chart is based on monthly increments
      • The data for this chart is based on monthly increments
      • The data for this chart is based on monthly increments
      • The data for this chart is based on monthly increments
      • The data for this chart is based on monthly increments
      • The data for this chart is based on monthly increments
      • The data for this chart is based on monthly increments
      • The data for this chart is based on monthly increments
      • The data for this chart is based on monthly increments
      • The data for this chart is based on monthly increments
      • The data for this chart is based on monthly increments
      • The data for this chart is based on monthly increments
      • The data for this chart is based on monthly increments
      • The data for this chart is based on monthly increments
      • The data for this chart is based on monthly increments
      • The data for this chart is based on monthly increments
      • The data for this chart is based on monthly increments
      • The data for this chart is based on monthly increments
      • The data for this chart is based on monthly increments
      • The data for this chart is based on monthly increments
      • The data for this chart is based on monthly increments
      • The data for this chart is based on monthly increments
      • The data for this chart is based on monthly increments
      • The data for this chart is based on monthly increments
      • The data for this chart is based on monthly increments
      • The data for this chart is based on monthly increments
      • The data for this chart is based on monthly increments
      • The data for this chart is based on monthly increments
      • The data for this chart is based on monthly increments
      • The data for this chart is based on monthly increments
      • The data for this chart is based on monthly increments
      • The data for this chart is based on monthly increments
      • The data for this chart is based on monthly increments
      • The data for this chart is based on monthly increments
      • The data for this chart is based on monthly increments
      • The data for this chart is based on monthly increments
      • The data for this chart is based on monthly increments
      • The data for this chart is based on monthly increments
      • The data for this chart is based on monthly increments
      • The data for this chart is based on monthly increments
      • The data for this chart is based on monthly increments
      • The data for this chart is based on monthly increments
      • The data for this chart is based on monthly increments
      • The data for this chart is based on monthly increments
      • The data for this chart is based on monthly increments
      • The data for this chart is based on monthly increments
      • The data for this chart is based on monthly increments
      • The data for this chart is based on monthly increments
      • The data for this chart is based on monthly increments
      • The data for this chart is based on monthly increments
      • The data for this chart is based on monthly increments
      • The data for this chart is based on monthly increments
      • The data for this chart is based on monthly increments
      • The data for this chart is based on monthly increments
      • The data for this chart is based on monthly increments
      • The data for this chart is based on monthly increments
      • The data for this chart is based on monthly increments
      • The data for this chart is based on monthly increments
      • The data for this chart is based on monthly increments
      • The data for this chart is based on monthly increments
      • The data for this chart is based on monthly increments
      • The data for this chart is based on monthly increments
      • The data for this chart is based on monthly increments
      • The data for this chart is based on monthly increments
      • The data for this chart is based on monthly increments
      • The data for this chart is based on monthly increments
      • The data for this chart is based on monthly increments
      • The data for this chart is based on monthly increments
      • The data for this chart is based on monthly increments
      • The data for this chart is based on monthly increments
      • The data for this chart is based on monthly increments
      • The data for this chart is based on monthly increments
      • The data for this chart is based on monthly increments
      • The data for this chart is based on monthly increments
      • The data for this chart is based on monthly increments
      • The data for this chart is based on monthly increments
      • The data for this chart is based on monthly increments
      • The data for this chart is based on monthly increments
      • The data for this chart is based on monthly increments
      • The data for this chart is based on monthly increments
      • The data for this chart is based on monthly increments
      • The data for this chart is based on monthly increments
      • The data for this chart is based on monthly increments
      • The data for this chart is based on monthly increments
      • The data for this chart is based on monthly increments
      • The data for this chart is based on monthly increments
      • The data for this chart is based on monthly increments
      • The data for this chart is based on monthly increments
      • The data for this chart is based on monthly increments
      • The data for this chart is based on monthly increments
      • The data for this chart is based on monthly increments
      • The data for this chart is based on monthly increments
      • The data for this chart is based on monthly increments
      • The data for this chart is based on monthly increments
      • The data for this chart is based on monthly increments
      • The data for this chart is based on monthly increments
      • The data for this chart is based on monthly increments
      • The data for this chart is based on monthly increments
      • The data for this chart is based on monthly increments
      • The data for this chart is based on monthly increments
      • The data for this chart is based on monthly increments
      • The data for this chart is based on monthly increments
      • The data for this chart is based on monthly increments
      • The data for this chart is based on monthly increments
      • The data for this chart is based on monthly increments
      • The data for this chart is based on monthly increments
      • The data for this chart is based on monthly increments
      • The data for this chart is based on monthly increments
      • The data for this chart is based on monthly increments
      • The data for this chart is based on monthly increments
      • The data for this chart is based on monthly increments
      • The data for this chart is based on monthly increments
      • The data for this chart is based on monthly increments
      • The data for this chart is based on monthly increments
      • The data for this chart is based on monthly increments
      • The data for this chart is based on monthly increments
      • The data for this chart is based on monthly increments
      • The data for this chart is based on monthly increments
      • The data for this chart is based on monthly increments
      • The data for this chart is based on monthly increments
      • The data for this chart is based on monthly increments
      • The data for this chart is based on monthly increments
      • The data for this chart is based on monthly increments
      • The data for this chart is based on monthly increments
      • The data for this chart is based on monthly increments
      • The data for this chart is based on monthly increments
      • The data for this chart is based on monthly increments
      • The data for this chart is based on monthly increments
      • The data for this chart is based on monthly increments
      • The data for this chart is based on monthly increments
      • The data for this chart is based on monthly increments
      • The data for this chart is based on monthly increments
      • The data for this chart is based on monthly increments
      • The data for this chart is based on monthly increments
      • The data for this chart is based on monthly increments
      • The data for this chart is based on monthly increments
      • The data for this chart is based on monthly increments
      • The data for this chart is based on monthly increments
      • The data for this chart is based on monthly increments
      • The data for this chart is based on monthly increments
      • The data for this chart is based on monthly increments
      • The data for this chart is based on monthly increments
      • The data for this chart is based on monthly increments
      • The data for this chart is based on monthly increments
      • The data for this chart is based on monthly increments
      • The data for this chart is based on monthly increments
      • The data for this chart is based on monthly increments
      • The data for this chart is based on monthly increments
      • The data for this chart is based on monthly increments
      • The data for this chart is based on monthly increments
      • The data for this chart is based on monthly increments
      • The data for this chart is based on monthly increments
      • The data for this chart is based on monthly increments
      • The data for this chart is based on monthly increments
      • The data for this chart is based on monthly increments
      • The data for this chart is based on monthly increments
      • The data for this chart is based on monthly increments
      • The data for this chart is based on monthly increments
      • The data for this chart is based on monthly increments
      • The data for this chart is based on monthly increments
      • The data for this chart is based on monthly increments
      • The data for this chart is based on monthly increments
      • The data for this chart is based on monthly increments
      • The data for this chart is based on monthly increments
      • The data for this chart is based on monthly increments
      • The data for this chart is based on monthly increments
      • The data for this chart is based on monthly increments
      • The data for this chart is based on monthly increments
      • The data for this chart is based on monthly increments
      • The data for this chart is based on monthly increments
      • The data for this chart is based on monthly increments
      • The data for this chart is based on monthly increments
      • The data for this chart is based on monthly increments
      • The data for this chart is based on monthly increments
      • The data for this chart is based on monthly increments
      • The data for this chart is based on monthly increments
      • The data for this chart is based on monthly increments
      • The data for this chart is based on monthly increments
      • The data for this chart is based on monthly increments
      • The data for this chart is based on monthly increments
      • The data for this chart is based on monthly increments
      • The data for this chart is based on monthly increments
      • The data for this chart is based on monthly increments
      • The data for this chart is based on monthly increments
      • The data for this chart is based on monthly increments
      • The data for this chart is based on monthly increments
      • The data for this chart is based on monthly increments
      • The data for this chart is based on monthly increments
      • The data for this chart is based on monthly increments
      • The data for this chart is based on monthly increments
      • The data for this chart is based on monthly increments
      • The data for this chart is based on monthly increments
      • The data for this chart is based on monthly increments
      • The data for this chart is based on monthly increments
      • The data for this chart is based on monthly increments
      • The data for this chart is based on monthly increments
      • The data for this chart is based on monthly increments
      • The data for this chart is based on monthly increments
      • The data for this chart is based on monthly increments
      • The data for this chart is based on monthly increments
      • The data for this chart is based on monthly increments
      • The data for this chart is based on monthly increments
      • The data for this chart is based on monthly increments
      • The data for this chart is based on monthly increments
      • The data for this chart is based on monthly increments
      • The data for this chart is based on monthly increments
      • The data for this chart is based on monthly increments
      • The data for this chart is based on monthly increments
      • The data for this chart is based on monthly increments
      • The data for this chart is based on monthly increments
      • The data for this chart is based on monthly increments
      • The data for this chart is based on monthly increments
      • The data for this chart is based on monthly increments
      • The data for this chart is based on monthly increments
      • The data for this chart is based on monthly increments
      • The data for this chart is based on monthly increments
      • The data for this chart is based on monthly increments
      • The data for this chart is based on monthly increments
      • The data for this chart is based on monthly increments
      • The data for this chart is based on monthly increments
      • The data for this chart is based on monthly increments
      • The data for this chart is based on monthly increments
      • The data for this chart is based on monthly increments
      • The data for this chart is based on monthly increments
      • The data for this chart is based on monthly increments
      • The data for this chart is based on monthly increments
      • The data for this chart is based on monthly increments
      • The data for this chart is based on monthly increments
      • The data for this chart is based on monthly increments
      • The data for this chart is based on monthly increments
      • The data for this chart is based on monthly increments
      • The data for this chart is based on monthly increments
      • The data for this chart is based on monthly increments
      • The data for this chart is based on monthly increments
      • The data for this chart is based on monthly increments
      • The data for this chart is based on monthly increments