LeVander Pond

Location Details

Description

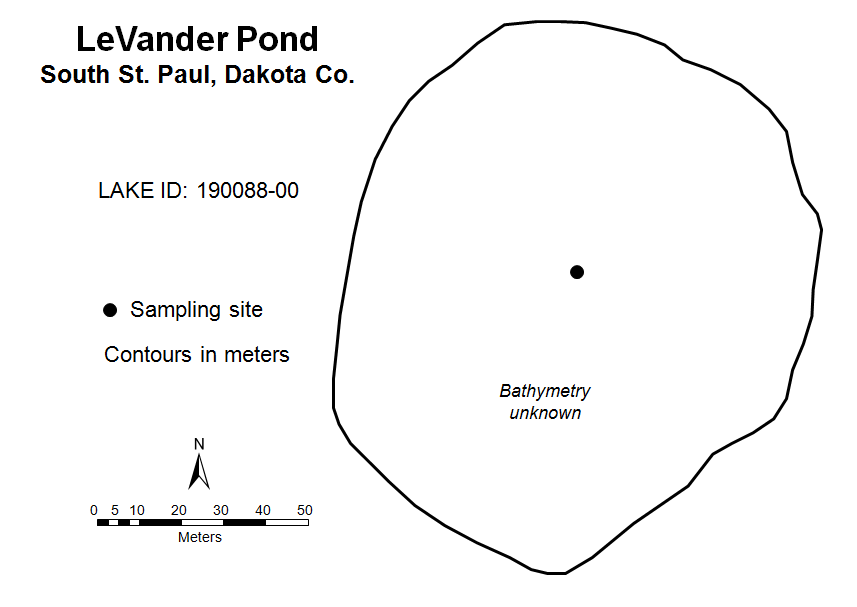
LeVander Pond is located in South St. Paul. It covers approximately 3 acres, and the maximum depth is unknown.

Waterbody Name
LeVander Pond, Site 1
Location Type
Lake
City
South St. Paul
County
Dakota
Water Management Organization
Lower Mississippi River WMO
Major Watershed
Mississippi River - Twin Cities
HUC8
07010206
Latitude
44.900389
Longitude
-93.064115
DNR Lake ID
19008800

Data Collected

Expand the menus below or use the search bar to select individual parameters and display availability of data on the right

Available Parameters

Data Availability over Time

      • The data for this chart is based on monthly increments
      • The data for this chart is based on monthly increments
      • The data for this chart is based on monthly increments
      • The data for this chart is based on monthly increments
      • The data for this chart is based on monthly increments
      • The data for this chart is based on monthly increments
      • The data for this chart is based on monthly increments
      • The data for this chart is based on monthly increments
      • The data for this chart is based on monthly increments
      • The data for this chart is based on monthly increments
      • The data for this chart is based on monthly increments
      • The data for this chart is based on monthly increments
      • The data for this chart is based on monthly increments
      • The data for this chart is based on monthly increments
      • The data for this chart is based on monthly increments
      • The data for this chart is based on monthly increments
      • The data for this chart is based on monthly increments
      • The data for this chart is based on monthly increments
      • The data for this chart is based on monthly increments
      • The data for this chart is based on monthly increments
      • The data for this chart is based on monthly increments
      • The data for this chart is based on monthly increments
      • The data for this chart is based on monthly increments
      • The data for this chart is based on monthly increments
      • The data for this chart is based on monthly increments
      • The data for this chart is based on monthly increments
      • The data for this chart is based on monthly increments
      • The data for this chart is based on monthly increments
      • The data for this chart is based on monthly increments
      • The data for this chart is based on monthly increments
      • The data for this chart is based on monthly increments
      • The data for this chart is based on monthly increments
      • The data for this chart is based on monthly increments
      • The data for this chart is based on monthly increments
      • The data for this chart is based on monthly increments
      • The data for this chart is based on monthly increments
      • The data for this chart is based on monthly increments
      • The data for this chart is based on monthly increments
      • The data for this chart is based on monthly increments
      • The data for this chart is based on monthly increments
      • The data for this chart is based on monthly increments
      • The data for this chart is based on monthly increments
      • The data for this chart is based on monthly increments
      • The data for this chart is based on monthly increments
      • The data for this chart is based on monthly increments
      • The data for this chart is based on monthly increments
      • The data for this chart is based on monthly increments
      • The data for this chart is based on monthly increments
      • The data for this chart is based on monthly increments
      • The data for this chart is based on monthly increments
      • The data for this chart is based on monthly increments
      • The data for this chart is based on monthly increments
      • The data for this chart is based on monthly increments
      • The data for this chart is based on monthly increments
      • The data for this chart is based on monthly increments
      • The data for this chart is based on monthly increments
      • The data for this chart is based on monthly increments
      • The data for this chart is based on monthly increments
      • The data for this chart is based on monthly increments
      • The data for this chart is based on monthly increments
      • The data for this chart is based on monthly increments
      • The data for this chart is based on monthly increments
      • The data for this chart is based on monthly increments
      • The data for this chart is based on monthly increments
      • The data for this chart is based on monthly increments
      • The data for this chart is based on monthly increments
      • The data for this chart is based on monthly increments
      • The data for this chart is based on monthly increments
      • The data for this chart is based on monthly increments
      • The data for this chart is based on monthly increments
      • The data for this chart is based on monthly increments
      • The data for this chart is based on monthly increments
      • The data for this chart is based on monthly increments
      • The data for this chart is based on monthly increments
      • The data for this chart is based on monthly increments
      • The data for this chart is based on monthly increments
      • The data for this chart is based on monthly increments
      • The data for this chart is based on monthly increments
      • The data for this chart is based on monthly increments
      • The data for this chart is based on monthly increments
      • The data for this chart is based on monthly increments
      • The data for this chart is based on monthly increments
      • The data for this chart is based on monthly increments
      • The data for this chart is based on monthly increments
      • The data for this chart is based on monthly increments
      • The data for this chart is based on monthly increments
      • The data for this chart is based on monthly increments
      • The data for this chart is based on monthly increments
      • The data for this chart is based on monthly increments
      • The data for this chart is based on monthly increments
      • The data for this chart is based on monthly increments
      • The data for this chart is based on monthly increments
      • The data for this chart is based on monthly increments
      • The data for this chart is based on monthly increments
      • The data for this chart is based on monthly increments
      • The data for this chart is based on monthly increments
      • The data for this chart is based on monthly increments
      • The data for this chart is based on monthly increments
      • The data for this chart is based on monthly increments
      • The data for this chart is based on monthly increments
      • The data for this chart is based on monthly increments
      • The data for this chart is based on monthly increments
      • The data for this chart is based on monthly increments
      • The data for this chart is based on monthly increments
      • The data for this chart is based on monthly increments
      • The data for this chart is based on monthly increments
      • The data for this chart is based on monthly increments
      • The data for this chart is based on monthly increments
      • The data for this chart is based on monthly increments
      • The data for this chart is based on monthly increments
      • The data for this chart is based on monthly increments
      • The data for this chart is based on monthly increments
      • The data for this chart is based on monthly increments
      • The data for this chart is based on monthly increments
      • The data for this chart is based on monthly increments
      • The data for this chart is based on monthly increments
      • The data for this chart is based on monthly increments
      • The data for this chart is based on monthly increments
      • The data for this chart is based on monthly increments
      • The data for this chart is based on monthly increments
      • The data for this chart is based on monthly increments
      • The data for this chart is based on monthly increments
      • The data for this chart is based on monthly increments
      • The data for this chart is based on monthly increments
      • The data for this chart is based on monthly increments
      • The data for this chart is based on monthly increments
      • The data for this chart is based on monthly increments
      • The data for this chart is based on monthly increments
      • The data for this chart is based on monthly increments
      • The data for this chart is based on monthly increments
      • The data for this chart is based on monthly increments
      • The data for this chart is based on monthly increments
      • The data for this chart is based on monthly increments
      • The data for this chart is based on monthly increments
      • The data for this chart is based on monthly increments
      • The data for this chart is based on monthly increments
      • The data for this chart is based on monthly increments
      • The data for this chart is based on monthly increments
      • The data for this chart is based on monthly increments
      • The data for this chart is based on monthly increments
      • The data for this chart is based on monthly increments
      • The data for this chart is based on monthly increments
      • The data for this chart is based on monthly increments
      • The data for this chart is based on monthly increments
      • The data for this chart is based on monthly increments
      • The data for this chart is based on monthly increments
      • The data for this chart is based on monthly increments
      • The data for this chart is based on monthly increments
      • The data for this chart is based on monthly increments
      • The data for this chart is based on monthly increments
      • The data for this chart is based on monthly increments
      • The data for this chart is based on monthly increments
      • The data for this chart is based on monthly increments
      • The data for this chart is based on monthly increments
      • The data for this chart is based on monthly increments
      • The data for this chart is based on monthly increments
      • The data for this chart is based on monthly increments
      • The data for this chart is based on monthly increments
      • The data for this chart is based on monthly increments
      • The data for this chart is based on monthly increments
      • The data for this chart is based on monthly increments
      • The data for this chart is based on monthly increments
      • The data for this chart is based on monthly increments
      • The data for this chart is based on monthly increments
      • The data for this chart is based on monthly increments
      • The data for this chart is based on monthly increments
      • The data for this chart is based on monthly increments
      • The data for this chart is based on monthly increments
      • The data for this chart is based on monthly increments
      • The data for this chart is based on monthly increments
      • The data for this chart is based on monthly increments
      • The data for this chart is based on monthly increments
      • The data for this chart is based on monthly increments
      • The data for this chart is based on monthly increments
      • The data for this chart is based on monthly increments
      • The data for this chart is based on monthly increments
      • The data for this chart is based on monthly increments
      • The data for this chart is based on monthly increments
      • The data for this chart is based on monthly increments
      • The data for this chart is based on monthly increments
      • The data for this chart is based on monthly increments
      • The data for this chart is based on monthly increments
      • The data for this chart is based on monthly increments
      • The data for this chart is based on monthly increments
      • The data for this chart is based on monthly increments
      • The data for this chart is based on monthly increments
      • The data for this chart is based on monthly increments
      • The data for this chart is based on monthly increments
      • The data for this chart is based on monthly increments
      • The data for this chart is based on monthly increments
      • The data for this chart is based on monthly increments
      • The data for this chart is based on monthly increments
      • The data for this chart is based on monthly increments
      • The data for this chart is based on monthly increments
      • The data for this chart is based on monthly increments
      • The data for this chart is based on monthly increments
      • The data for this chart is based on monthly increments
      • The data for this chart is based on monthly increments
      • The data for this chart is based on monthly increments
      • The data for this chart is based on monthly increments
      • The data for this chart is based on monthly increments
      • The data for this chart is based on monthly increments
      • The data for this chart is based on monthly increments
      • The data for this chart is based on monthly increments
      • The data for this chart is based on monthly increments
      • The data for this chart is based on monthly increments
      • The data for this chart is based on monthly increments
      • The data for this chart is based on monthly increments
      • The data for this chart is based on monthly increments
      • The data for this chart is based on monthly increments
      • The data for this chart is based on monthly increments
      • The data for this chart is based on monthly increments
      • The data for this chart is based on monthly increments
      • The data for this chart is based on monthly increments
      • The data for this chart is based on monthly increments
      • The data for this chart is based on monthly increments
      • The data for this chart is based on monthly increments
      • The data for this chart is based on monthly increments
      • The data for this chart is based on monthly increments
      • The data for this chart is based on monthly increments
      • The data for this chart is based on monthly increments
      • The data for this chart is based on monthly increments
      • The data for this chart is based on monthly increments
      • The data for this chart is based on monthly increments
      • The data for this chart is based on monthly increments
      • The data for this chart is based on monthly increments
      • The data for this chart is based on monthly increments
      • The data for this chart is based on monthly increments
      • The data for this chart is based on monthly increments
      • The data for this chart is based on monthly increments
      • The data for this chart is based on monthly increments
      • The data for this chart is based on monthly increments
      • The data for this chart is based on monthly increments
      • The data for this chart is based on monthly increments
      • The data for this chart is based on monthly increments
      • The data for this chart is based on monthly increments
      • The data for this chart is based on monthly increments
      • The data for this chart is based on monthly increments
      • The data for this chart is based on monthly increments
      • The data for this chart is based on monthly increments
      • The data for this chart is based on monthly increments
      • The data for this chart is based on monthly increments
      • The data for this chart is based on monthly increments
      • The data for this chart is based on monthly increments
      • The data for this chart is based on monthly increments
      • The data for this chart is based on monthly increments
      • The data for this chart is based on monthly increments
      • The data for this chart is based on monthly increments
      • The data for this chart is based on monthly increments
      • The data for this chart is based on monthly increments
      • The data for this chart is based on monthly increments
      • The data for this chart is based on monthly increments
      • The data for this chart is based on monthly increments
      • The data for this chart is based on monthly increments
      • The data for this chart is based on monthly increments
      • The data for this chart is based on monthly increments
      • The data for this chart is based on monthly increments
      • The data for this chart is based on monthly increments
      • The data for this chart is based on monthly increments
      • The data for this chart is based on monthly increments
      • The data for this chart is based on monthly increments
      • The data for this chart is based on monthly increments
      • The data for this chart is based on monthly increments
      • The data for this chart is based on monthly increments
      • The data for this chart is based on monthly increments
      • The data for this chart is based on monthly increments
      • The data for this chart is based on monthly increments
      • The data for this chart is based on monthly increments
      • The data for this chart is based on monthly increments
      • The data for this chart is based on monthly increments