Wilmes Lake

Location Details

Description

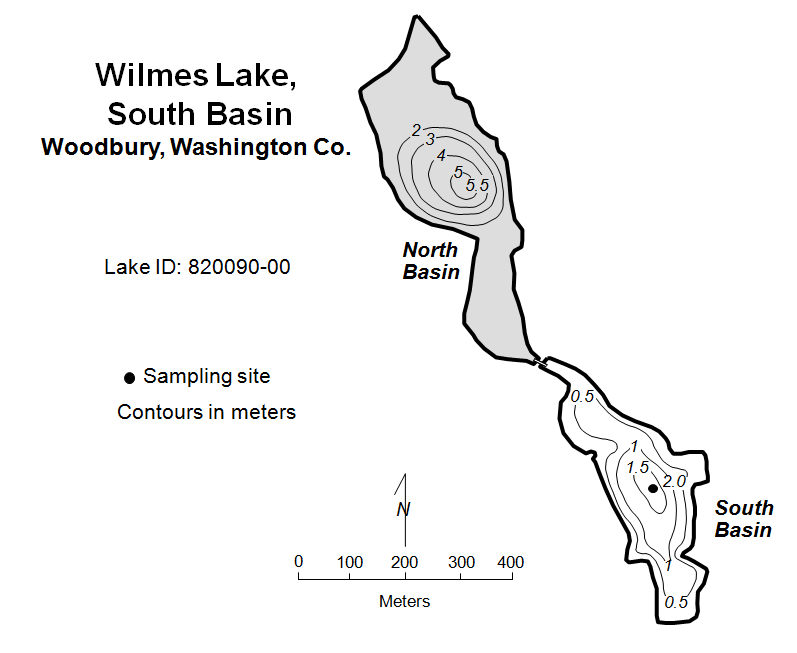
Wilmes Lake is located in Woodbury. It covers approximately 41 acres and is split into two basins of about equal size. The deepest point of the lake is in the north basin (about 6 meters).

Waterbody Name
Wilmes Lake, Site 1
Location Type
Lake
City
Woodbury
County
Washington
Water Management Organization
South Washington WD
Major Watershed
Mississippi River - Twin Cities
HUC8
07010206
Latitude
44.927944
Longitude
-92.912605
DNR Lake ID
82009002

Data Collected

Expand the menus below or use the search bar to select individual parameters and display availability of data on the right

Available Parameters

Data Availability over Time

      • The data for this chart is based on monthly increments
      • The data for this chart is based on monthly increments
      • The data for this chart is based on monthly increments
      • The data for this chart is based on monthly increments
      • The data for this chart is based on monthly increments
      • The data for this chart is based on monthly increments
      • The data for this chart is based on monthly increments
      • The data for this chart is based on monthly increments
      • The data for this chart is based on monthly increments
      • The data for this chart is based on monthly increments
      • The data for this chart is based on monthly increments
      • The data for this chart is based on monthly increments
      • The data for this chart is based on monthly increments
      • The data for this chart is based on monthly increments
      • The data for this chart is based on monthly increments
      • The data for this chart is based on monthly increments
      • The data for this chart is based on monthly increments
      • The data for this chart is based on monthly increments
      • The data for this chart is based on monthly increments
      • The data for this chart is based on monthly increments
      • The data for this chart is based on monthly increments
      • The data for this chart is based on monthly increments
      • The data for this chart is based on monthly increments
      • The data for this chart is based on monthly increments
      • The data for this chart is based on monthly increments
      • The data for this chart is based on monthly increments
      • The data for this chart is based on monthly increments
      • The data for this chart is based on monthly increments
      • The data for this chart is based on monthly increments
      • The data for this chart is based on monthly increments
      • The data for this chart is based on monthly increments
      • The data for this chart is based on monthly increments
      • The data for this chart is based on monthly increments
      • The data for this chart is based on monthly increments
      • The data for this chart is based on monthly increments
      • The data for this chart is based on monthly increments
      • The data for this chart is based on monthly increments
      • The data for this chart is based on monthly increments
      • The data for this chart is based on monthly increments
      • The data for this chart is based on monthly increments
      • The data for this chart is based on monthly increments
      • The data for this chart is based on monthly increments
      • The data for this chart is based on monthly increments
      • The data for this chart is based on monthly increments
      • The data for this chart is based on monthly increments
      • The data for this chart is based on monthly increments
      • The data for this chart is based on monthly increments
      • The data for this chart is based on monthly increments
      • The data for this chart is based on monthly increments
      • The data for this chart is based on monthly increments
      • The data for this chart is based on monthly increments
      • The data for this chart is based on monthly increments
      • The data for this chart is based on monthly increments
      • The data for this chart is based on monthly increments
      • The data for this chart is based on monthly increments
      • The data for this chart is based on monthly increments
      • The data for this chart is based on monthly increments
      • The data for this chart is based on monthly increments
      • The data for this chart is based on monthly increments
      • The data for this chart is based on monthly increments
      • The data for this chart is based on monthly increments
      • The data for this chart is based on monthly increments
      • The data for this chart is based on monthly increments
      • The data for this chart is based on monthly increments
      • The data for this chart is based on monthly increments
      • The data for this chart is based on monthly increments
      • The data for this chart is based on monthly increments
      • The data for this chart is based on monthly increments
      • The data for this chart is based on monthly increments
      • The data for this chart is based on monthly increments
      • The data for this chart is based on monthly increments
      • The data for this chart is based on monthly increments
      • The data for this chart is based on monthly increments
      • The data for this chart is based on monthly increments
      • The data for this chart is based on monthly increments
      • The data for this chart is based on monthly increments
      • The data for this chart is based on monthly increments
      • The data for this chart is based on monthly increments
      • The data for this chart is based on monthly increments
      • The data for this chart is based on monthly increments
      • The data for this chart is based on monthly increments
      • The data for this chart is based on monthly increments
      • The data for this chart is based on monthly increments
      • The data for this chart is based on monthly increments
      • The data for this chart is based on monthly increments
      • The data for this chart is based on monthly increments
      • The data for this chart is based on monthly increments
      • The data for this chart is based on monthly increments
      • The data for this chart is based on monthly increments
      • The data for this chart is based on monthly increments
      • The data for this chart is based on monthly increments
      • The data for this chart is based on monthly increments
      • The data for this chart is based on monthly increments
      • The data for this chart is based on monthly increments
      • The data for this chart is based on monthly increments
      • The data for this chart is based on monthly increments
      • The data for this chart is based on monthly increments
      • The data for this chart is based on monthly increments
      • The data for this chart is based on monthly increments
      • The data for this chart is based on monthly increments
      • The data for this chart is based on monthly increments
      • The data for this chart is based on monthly increments
      • The data for this chart is based on monthly increments
      • The data for this chart is based on monthly increments
      • The data for this chart is based on monthly increments
      • The data for this chart is based on monthly increments
      • The data for this chart is based on monthly increments
      • The data for this chart is based on monthly increments
      • The data for this chart is based on monthly increments
      • The data for this chart is based on monthly increments
      • The data for this chart is based on monthly increments
      • The data for this chart is based on monthly increments
      • The data for this chart is based on monthly increments
      • The data for this chart is based on monthly increments
      • The data for this chart is based on monthly increments
      • The data for this chart is based on monthly increments
      • The data for this chart is based on monthly increments
      • The data for this chart is based on monthly increments
      • The data for this chart is based on monthly increments
      • The data for this chart is based on monthly increments
      • The data for this chart is based on monthly increments
      • The data for this chart is based on monthly increments
      • The data for this chart is based on monthly increments
      • The data for this chart is based on monthly increments
      • The data for this chart is based on monthly increments
      • The data for this chart is based on monthly increments
      • The data for this chart is based on monthly increments
      • The data for this chart is based on monthly increments
      • The data for this chart is based on monthly increments
      • The data for this chart is based on monthly increments
      • The data for this chart is based on monthly increments
      • The data for this chart is based on monthly increments
      • The data for this chart is based on monthly increments
      • The data for this chart is based on monthly increments
      • The data for this chart is based on monthly increments
      • The data for this chart is based on monthly increments
      • The data for this chart is based on monthly increments
      • The data for this chart is based on monthly increments
      • The data for this chart is based on monthly increments
      • The data for this chart is based on monthly increments
      • The data for this chart is based on monthly increments
      • The data for this chart is based on monthly increments
      • The data for this chart is based on monthly increments
      • The data for this chart is based on monthly increments
      • The data for this chart is based on monthly increments
      • The data for this chart is based on monthly increments
      • The data for this chart is based on monthly increments
      • The data for this chart is based on monthly increments
      • The data for this chart is based on monthly increments
      • The data for this chart is based on monthly increments
      • The data for this chart is based on monthly increments
      • The data for this chart is based on monthly increments
      • The data for this chart is based on monthly increments
      • The data for this chart is based on monthly increments
      • The data for this chart is based on monthly increments
      • The data for this chart is based on monthly increments
      • The data for this chart is based on monthly increments
      • The data for this chart is based on monthly increments
      • The data for this chart is based on monthly increments
      • The data for this chart is based on monthly increments
      • The data for this chart is based on monthly increments
      • The data for this chart is based on monthly increments
      • The data for this chart is based on monthly increments
      • The data for this chart is based on monthly increments
      • The data for this chart is based on monthly increments
      • The data for this chart is based on monthly increments
      • The data for this chart is based on monthly increments
      • The data for this chart is based on monthly increments
      • The data for this chart is based on monthly increments
      • The data for this chart is based on monthly increments
      • The data for this chart is based on monthly increments
      • The data for this chart is based on monthly increments
      • The data for this chart is based on monthly increments
      • The data for this chart is based on monthly increments
      • The data for this chart is based on monthly increments
      • The data for this chart is based on monthly increments
      • The data for this chart is based on monthly increments
      • The data for this chart is based on monthly increments
      • The data for this chart is based on monthly increments
      • The data for this chart is based on monthly increments
      • The data for this chart is based on monthly increments
      • The data for this chart is based on monthly increments
      • The data for this chart is based on monthly increments
      • The data for this chart is based on monthly increments
      • The data for this chart is based on monthly increments
      • The data for this chart is based on monthly increments
      • The data for this chart is based on monthly increments
      • The data for this chart is based on monthly increments
      • The data for this chart is based on monthly increments
      • The data for this chart is based on monthly increments
      • The data for this chart is based on monthly increments
      • The data for this chart is based on monthly increments
      • The data for this chart is based on monthly increments
      • The data for this chart is based on monthly increments
      • The data for this chart is based on monthly increments
      • The data for this chart is based on monthly increments
      • The data for this chart is based on monthly increments
      • The data for this chart is based on monthly increments
      • The data for this chart is based on monthly increments
      • The data for this chart is based on monthly increments
      • The data for this chart is based on monthly increments
      • The data for this chart is based on monthly increments
      • The data for this chart is based on monthly increments
      • The data for this chart is based on monthly increments
      • The data for this chart is based on monthly increments
      • The data for this chart is based on monthly increments
      • The data for this chart is based on monthly increments
      • The data for this chart is based on monthly increments
      • The data for this chart is based on monthly increments
      • The data for this chart is based on monthly increments
      • The data for this chart is based on monthly increments
      • The data for this chart is based on monthly increments
      • The data for this chart is based on monthly increments
      • The data for this chart is based on monthly increments
      • The data for this chart is based on monthly increments
      • The data for this chart is based on monthly increments
      • The data for this chart is based on monthly increments
      • The data for this chart is based on monthly increments
      • The data for this chart is based on monthly increments
      • The data for this chart is based on monthly increments
      • The data for this chart is based on monthly increments
      • The data for this chart is based on monthly increments
      • The data for this chart is based on monthly increments
      • The data for this chart is based on monthly increments
      • The data for this chart is based on monthly increments
      • The data for this chart is based on monthly increments
      • The data for this chart is based on monthly increments
      • The data for this chart is based on monthly increments
      • The data for this chart is based on monthly increments
      • The data for this chart is based on monthly increments
      • The data for this chart is based on monthly increments
      • The data for this chart is based on monthly increments
      • The data for this chart is based on monthly increments
      • The data for this chart is based on monthly increments
      • The data for this chart is based on monthly increments
      • The data for this chart is based on monthly increments
      • The data for this chart is based on monthly increments
      • The data for this chart is based on monthly increments
      • The data for this chart is based on monthly increments
      • The data for this chart is based on monthly increments
      • The data for this chart is based on monthly increments
      • The data for this chart is based on monthly increments
      • The data for this chart is based on monthly increments
      • The data for this chart is based on monthly increments
      • The data for this chart is based on monthly increments
      • The data for this chart is based on monthly increments
      • The data for this chart is based on monthly increments
      • The data for this chart is based on monthly increments
      • The data for this chart is based on monthly increments
      • The data for this chart is based on monthly increments
      • The data for this chart is based on monthly increments
      • The data for this chart is based on monthly increments
      • The data for this chart is based on monthly increments
      • The data for this chart is based on monthly increments
      • The data for this chart is based on monthly increments
      • The data for this chart is based on monthly increments
      • The data for this chart is based on monthly increments
      • The data for this chart is based on monthly increments
      • The data for this chart is based on monthly increments
      • The data for this chart is based on monthly increments
      • The data for this chart is based on monthly increments
      • The data for this chart is based on monthly increments
      • The data for this chart is based on monthly increments
      • The data for this chart is based on monthly increments
      • The data for this chart is based on monthly increments
      • The data for this chart is based on monthly increments
      • The data for this chart is based on monthly increments
      • The data for this chart is based on monthly increments
      • The data for this chart is based on monthly increments
      • The data for this chart is based on monthly increments