Bassett Creek Watershed

Location Details

Description

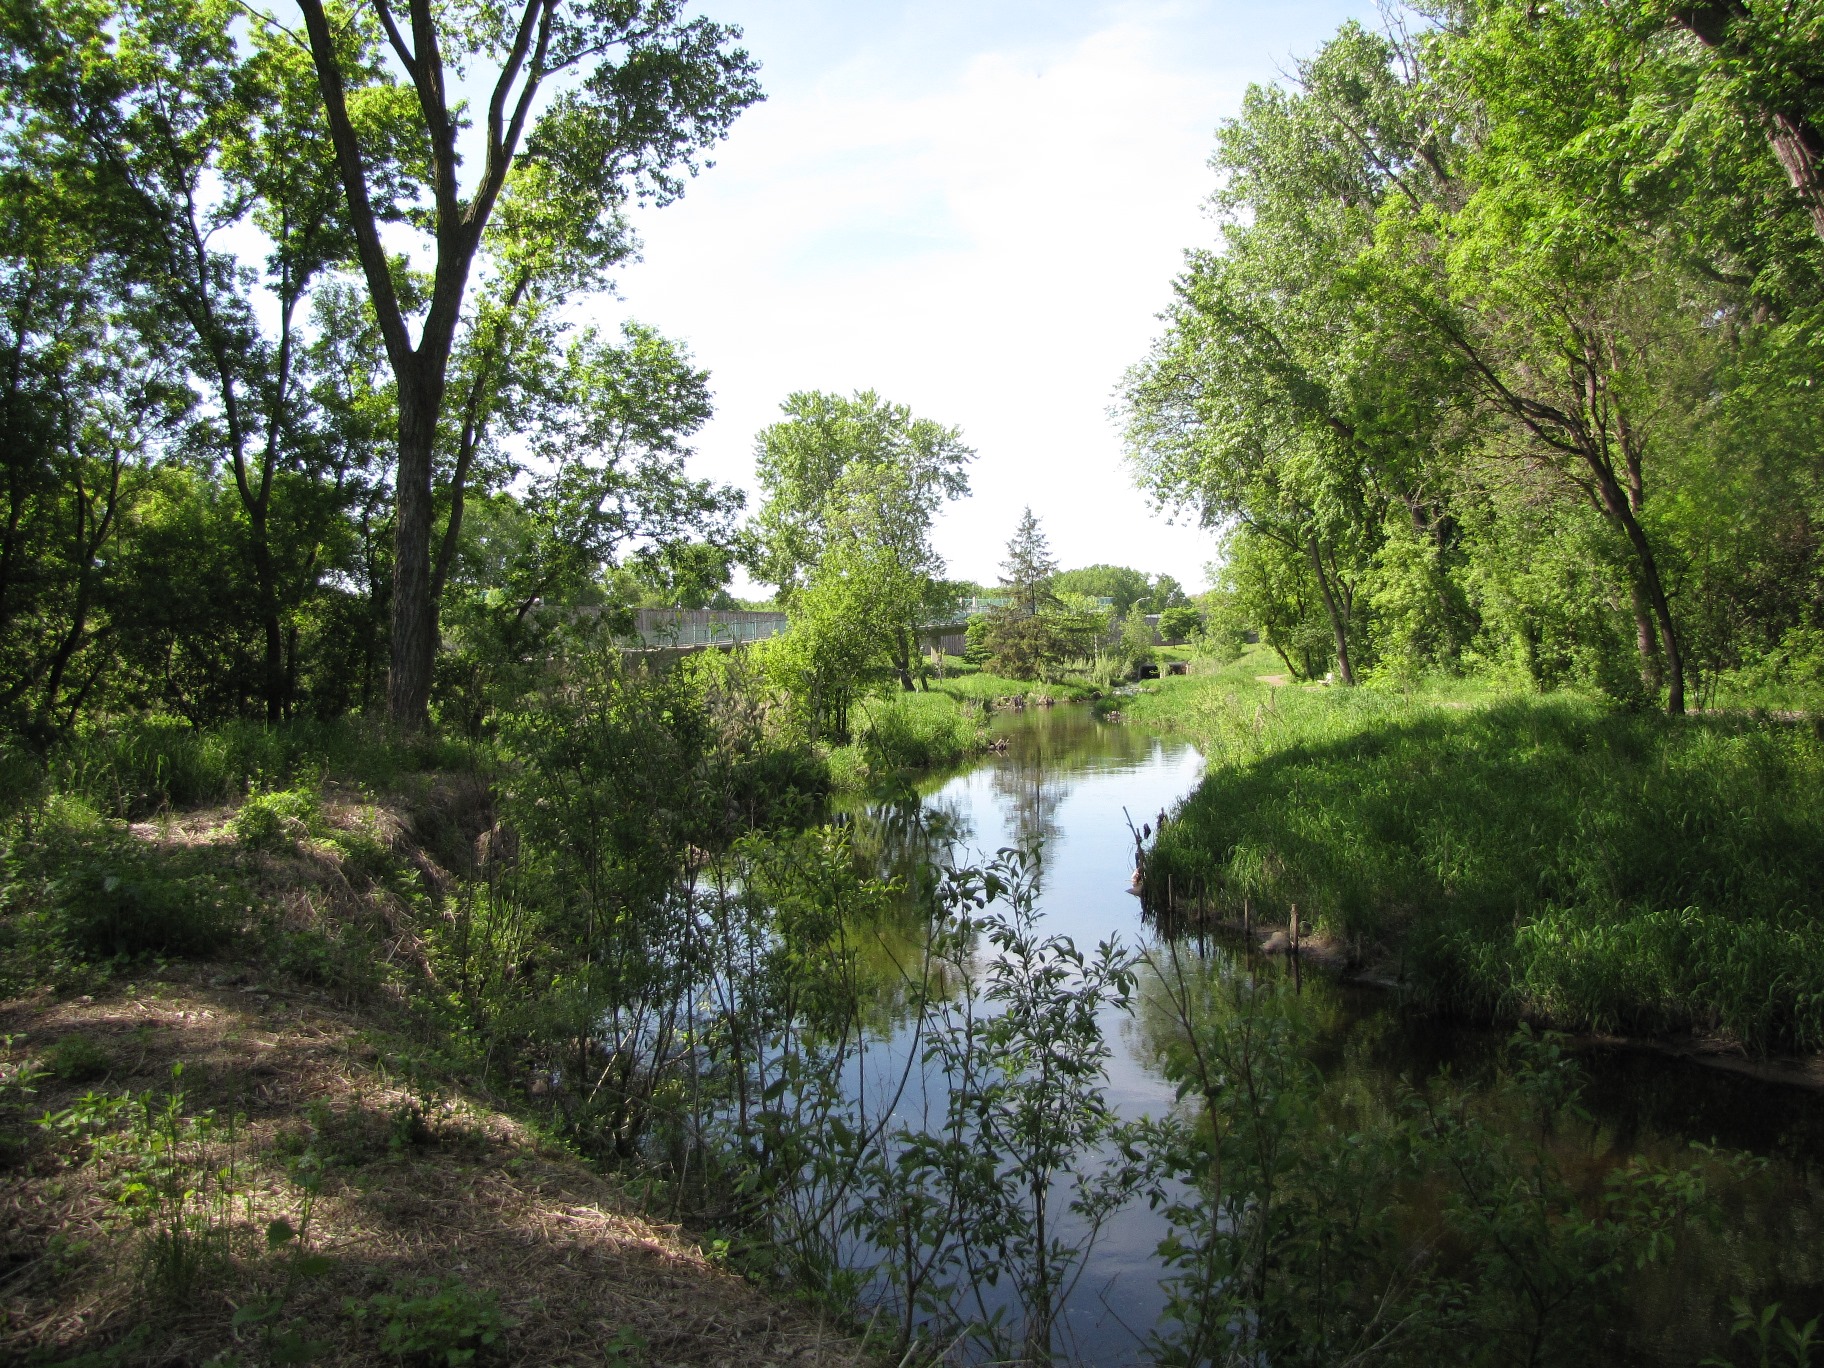
Bassett Creek is an urban creek located in the north central metropolitan area. It begins at the Medicine Lake outlet and runs through a number of parks along its path, providing habitat for wildlife and the opportunity for recreational activities, before flowing through a storm tunnel under downtown Minneapolis and discharging into the Mississippi River.

Bassett Creek at Irving Ave, River Mile 1.9 is a WOMP (Watershed Outlet Monitoring Program) station. It monitors the water quality of Bassett Creek before it enters into the pipe which travels under Minneapolis and discharges into the Mississippi River. Samples are collected at regular intervals for baseflow and also during storm events. This station also has automatic monitoring equipment which takes measurements every 15 minutes. This continuous data can be found under the "Time Series" dropdown in the "Data Collected" section located farther down on this webpage.

Waterbody Name
Bassett Creek Watershed
Location Type
River/Stream
Major Watershed
Mississippi River - Twin Cities
HUC8
07010206

Related Documents

Data Collected

Expand the menus below or use the search bar to select individual parameters and display availability of data on the right

Available Parameters

Data Availability over Time

      • The data for this chart is based on monthly increments
      • The data for this chart is based on monthly increments
      • The data for this chart is based on monthly increments
      • The data for this chart is based on monthly increments
      • The data for this chart is based on monthly increments
      • The data for this chart is based on monthly increments
      • The data for this chart is based on monthly increments
      • The data for this chart is based on monthly increments
      • The data for this chart is based on monthly increments
      • The data for this chart is based on monthly increments
      • The data for this chart is based on monthly increments
      • The data for this chart is based on monthly increments
      • The data for this chart is based on monthly increments
      • The data for this chart is based on monthly increments
      • The data for this chart is based on monthly increments
      • The data for this chart is based on monthly increments
      • The data for this chart is based on monthly increments
      • The data for this chart is based on monthly increments
      • The data for this chart is based on monthly increments
      • The data for this chart is based on monthly increments
      • The data for this chart is based on monthly increments
      • The data for this chart is based on monthly increments
      • The data for this chart is based on monthly increments
      • The data for this chart is based on monthly increments
      • The data for this chart is based on monthly increments
      • The data for this chart is based on monthly increments
      • The data for this chart is based on monthly increments
      • The data for this chart is based on monthly increments
      • The data for this chart is based on monthly increments
      • The data for this chart is based on monthly increments
      • The data for this chart is based on monthly increments
      • The data for this chart is based on monthly increments
      • The data for this chart is based on monthly increments
      • The data for this chart is based on monthly increments
      • The data for this chart is based on monthly increments
      • The data for this chart is based on monthly increments
      • The data for this chart is based on monthly increments
      • The data for this chart is based on monthly increments
      • The data for this chart is based on monthly increments
      • The data for this chart is based on monthly increments
      • The data for this chart is based on monthly increments
      • The data for this chart is based on monthly increments
      • The data for this chart is based on monthly increments
      • The data for this chart is based on monthly increments
      • The data for this chart is based on monthly increments
      • The data for this chart is based on monthly increments
      • The data for this chart is based on monthly increments
      • The data for this chart is based on monthly increments
      • The data for this chart is based on monthly increments
      • The data for this chart is based on monthly increments
      • The data for this chart is based on monthly increments
      • The data for this chart is based on monthly increments
      • The data for this chart is based on monthly increments
      • The data for this chart is based on monthly increments
      • The data for this chart is based on monthly increments
      • The data for this chart is based on monthly increments
      • The data for this chart is based on monthly increments
      • The data for this chart is based on monthly increments
      • The data for this chart is based on monthly increments
      • The data for this chart is based on monthly increments
      • The data for this chart is based on monthly increments
      • The data for this chart is based on monthly increments
      • The data for this chart is based on monthly increments
      • The data for this chart is based on monthly increments
      • The data for this chart is based on monthly increments
      • The data for this chart is based on monthly increments
      • The data for this chart is based on monthly increments
      • The data for this chart is based on monthly increments
      • The data for this chart is based on monthly increments
      • The data for this chart is based on monthly increments
      • The data for this chart is based on monthly increments
      • The data for this chart is based on monthly increments
      • The data for this chart is based on monthly increments
      • The data for this chart is based on monthly increments
      • The data for this chart is based on monthly increments
      • The data for this chart is based on monthly increments
      • The data for this chart is based on monthly increments
      • The data for this chart is based on monthly increments
      • The data for this chart is based on monthly increments
      • The data for this chart is based on monthly increments
      • The data for this chart is based on monthly increments
      • The data for this chart is based on monthly increments
      • The data for this chart is based on monthly increments
      • The data for this chart is based on monthly increments
      • The data for this chart is based on monthly increments
      • The data for this chart is based on monthly increments
      • The data for this chart is based on monthly increments
      • The data for this chart is based on monthly increments
      • The data for this chart is based on monthly increments
      • The data for this chart is based on monthly increments
      • The data for this chart is based on monthly increments
      • The data for this chart is based on monthly increments
      • The data for this chart is based on monthly increments
      • The data for this chart is based on monthly increments
      • The data for this chart is based on monthly increments
      • The data for this chart is based on monthly increments
      • The data for this chart is based on monthly increments
      • The data for this chart is based on monthly increments
      • The data for this chart is based on monthly increments
      • The data for this chart is based on monthly increments
      • The data for this chart is based on monthly increments
      • The data for this chart is based on monthly increments
      • The data for this chart is based on monthly increments
      • The data for this chart is based on monthly increments
      • The data for this chart is based on monthly increments
      • The data for this chart is based on monthly increments
      • The data for this chart is based on monthly increments
      • The data for this chart is based on monthly increments
      • The data for this chart is based on monthly increments
      • The data for this chart is based on monthly increments
      • The data for this chart is based on monthly increments
      • The data for this chart is based on monthly increments
      • The data for this chart is based on monthly increments
      • The data for this chart is based on monthly increments
      • The data for this chart is based on monthly increments
      • The data for this chart is based on monthly increments
      • The data for this chart is based on monthly increments
      • The data for this chart is based on monthly increments
      • The data for this chart is based on monthly increments
      • The data for this chart is based on monthly increments
      • The data for this chart is based on monthly increments
      • The data for this chart is based on monthly increments
      • The data for this chart is based on monthly increments
      • The data for this chart is based on monthly increments
      • The data for this chart is based on monthly increments
      • The data for this chart is based on monthly increments
      • The data for this chart is based on monthly increments
      • The data for this chart is based on monthly increments
      • The data for this chart is based on monthly increments
      • The data for this chart is based on monthly increments
      • The data for this chart is based on monthly increments
      • The data for this chart is based on monthly increments
      • The data for this chart is based on monthly increments
      • The data for this chart is based on monthly increments
      • The data for this chart is based on monthly increments
      • The data for this chart is based on monthly increments
      • The data for this chart is based on monthly increments
      • The data for this chart is based on monthly increments
      • The data for this chart is based on monthly increments
      • The data for this chart is based on monthly increments
      • The data for this chart is based on monthly increments
      • The data for this chart is based on monthly increments
      • The data for this chart is based on monthly increments
      • The data for this chart is based on monthly increments
      • The data for this chart is based on monthly increments
      • The data for this chart is based on monthly increments
      • The data for this chart is based on monthly increments
      • The data for this chart is based on monthly increments
      • The data for this chart is based on monthly increments
      • The data for this chart is based on monthly increments
      • The data for this chart is based on monthly increments
      • The data for this chart is based on monthly increments
      • The data for this chart is based on monthly increments
      • The data for this chart is based on monthly increments
      • The data for this chart is based on monthly increments
      • The data for this chart is based on monthly increments
      • The data for this chart is based on monthly increments
      • The data for this chart is based on monthly increments
      • The data for this chart is based on monthly increments
      • The data for this chart is based on monthly increments
      • The data for this chart is based on monthly increments
      • The data for this chart is based on monthly increments
      • The data for this chart is based on monthly increments
      • The data for this chart is based on monthly increments
      • The data for this chart is based on monthly increments
      • The data for this chart is based on monthly increments
      • The data for this chart is based on monthly increments
      • The data for this chart is based on monthly increments
      • The data for this chart is based on monthly increments
      • The data for this chart is based on monthly increments
      • The data for this chart is based on monthly increments
      • The data for this chart is based on monthly increments
      • The data for this chart is based on monthly increments
      • The data for this chart is based on monthly increments
      • The data for this chart is based on monthly increments
      • The data for this chart is based on monthly increments
      • The data for this chart is based on monthly increments
      • The data for this chart is based on monthly increments
      • The data for this chart is based on monthly increments
      • The data for this chart is based on monthly increments
      • The data for this chart is based on monthly increments
      • The data for this chart is based on monthly increments
      • The data for this chart is based on monthly increments
      • The data for this chart is based on monthly increments
      • The data for this chart is based on monthly increments
      • The data for this chart is based on monthly increments
      • The data for this chart is based on monthly increments
      • The data for this chart is based on monthly increments
      • The data for this chart is based on monthly increments
      • The data for this chart is based on monthly increments
      • The data for this chart is based on monthly increments
      • The data for this chart is based on monthly increments
      • The data for this chart is based on monthly increments
      • The data for this chart is based on monthly increments
      • The data for this chart is based on monthly increments
      • The data for this chart is based on monthly increments
      • The data for this chart is based on monthly increments
      • The data for this chart is based on monthly increments
      • The data for this chart is based on monthly increments
      • The data for this chart is based on monthly increments
      • The data for this chart is based on monthly increments
      • The data for this chart is based on monthly increments
      • The data for this chart is based on monthly increments
      • The data for this chart is based on monthly increments
      • The data for this chart is based on monthly increments
      • The data for this chart is based on monthly increments
      • The data for this chart is based on monthly increments
      • The data for this chart is based on monthly increments
      • The data for this chart is based on monthly increments
      • The data for this chart is based on monthly increments
      • The data for this chart is based on monthly increments
      • The data for this chart is based on monthly increments
      • The data for this chart is based on monthly increments
      • The data for this chart is based on monthly increments
      • The data for this chart is based on monthly increments
      • The data for this chart is based on monthly increments
      • The data for this chart is based on monthly increments
      • The data for this chart is based on monthly increments
      • The data for this chart is based on monthly increments
      • The data for this chart is based on monthly increments
      • The data for this chart is based on monthly increments
      • The data for this chart is based on monthly increments
      • The data for this chart is based on monthly increments
      • The data for this chart is based on monthly increments
      • The data for this chart is based on monthly increments
      • The data for this chart is based on monthly increments
      • The data for this chart is based on monthly increments
      • The data for this chart is based on monthly increments
      • The data for this chart is based on monthly increments
      • The data for this chart is based on monthly increments
      • The data for this chart is based on monthly increments
      • The data for this chart is based on monthly increments
      • The data for this chart is based on monthly increments
      • The data for this chart is based on monthly increments
      • The data for this chart is based on monthly increments
      • The data for this chart is based on monthly increments
      • The data for this chart is based on monthly increments
      • The data for this chart is based on monthly increments
      • The data for this chart is based on monthly increments
      • The data for this chart is based on monthly increments
      • The data for this chart is based on monthly increments
      • The data for this chart is based on monthly increments
      • The data for this chart is based on monthly increments
      • The data for this chart is based on monthly increments
      • The data for this chart is based on monthly increments
      • The data for this chart is based on monthly increments
      • The data for this chart is based on monthly increments
      • The data for this chart is based on monthly increments
      • The data for this chart is based on monthly increments
      • The data for this chart is based on monthly increments
      • The data for this chart is based on monthly increments
      • The data for this chart is based on monthly increments
      • The data for this chart is based on monthly increments
      • The data for this chart is based on monthly increments
      • The data for this chart is based on monthly increments
      • The data for this chart is based on monthly increments
      • The data for this chart is based on monthly increments
      • The data for this chart is based on monthly increments
      • The data for this chart is based on monthly increments
      • The data for this chart is based on monthly increments
      • The data for this chart is based on monthly increments
      • The data for this chart is based on monthly increments
      • The data for this chart is based on monthly increments
      • The data for this chart is based on monthly increments
      • The data for this chart is based on monthly increments
      • The data for this chart is based on monthly increments
      • The data for this chart is based on monthly increments
      • The data for this chart is based on monthly increments
      • The data for this chart is based on monthly increments
      • The data for this chart is based on monthly increments